Signal Detection Theory - Project
October 10, 2021
What is signal detection theory?
Signal detection theory is the measure of distinction between signals that carry information and signals that are just noise. Measuring the difference is important to make sure decisions are based on actual information, and not random noise or uncertainty. In the healthcare field specifically, this is crucial to ensure hospital staff can tell the difference between specific alarms and act on that information.
I am going to conduct a signal detection theory experiment on myself using a psychological battery software called PEBL, so that we can see what affects the sensitivity and criterion of signal detection.
First, a quick summary of signal detection theory and useful vocabulary. Sensitivity measures how well people can discriminate between two signals. Sensitivity is measured by the d prime value (d’). Criterion (or bias) is a threshold that can be manipulated. We can decide how many correct rejects we want or how many false alarms we want in our responses. Basically, the criterion measures how conservative or liberal we are with our responses. Criterion is measured by beta.
Experimental Design
To conduct this experiment, I used the built in signal detection theory program in PEBL. I am presented with dashes and stars in either A formation (less than 50% stars) or B formation (more than 50% stars).
Step 1
There are three conditions that I conducted in Step 1:
- 50:50 where 50% of the test was formation A and 50% was formation B
- 3:1 where 60% of the test was formation A and 20% was formation B
- 1:3 where 20% of the test was formation A and 60% was formation B
Step 1
There are three conditions that I conducted in Step 1:
- 50:50 where 50% of the test was formation A and 50% was formation B
- 3:1 where 60% of the test was formation A and 20% was formation B
- 1:3 where 20% of the test was formation A and 60% was formation B


Step 4
I changed the mean of A to 40 from 46, meaning now A has a smaller average of stars. Under this new parameter, I conducted the same three conditions as step 1 (50:50, 3:1, 1:3).
Variables:
IV= Condition, what button I pressed, if it was the correct response
DV = hit rate, false alarm rate
Methods
I conducted all three conditions for both Step 1 and 4 on myself. I made sure to be in a quiet room with minimal distractions. I conducted each test one time. The PEBL software stored my responses automatically.
Results
Step 1
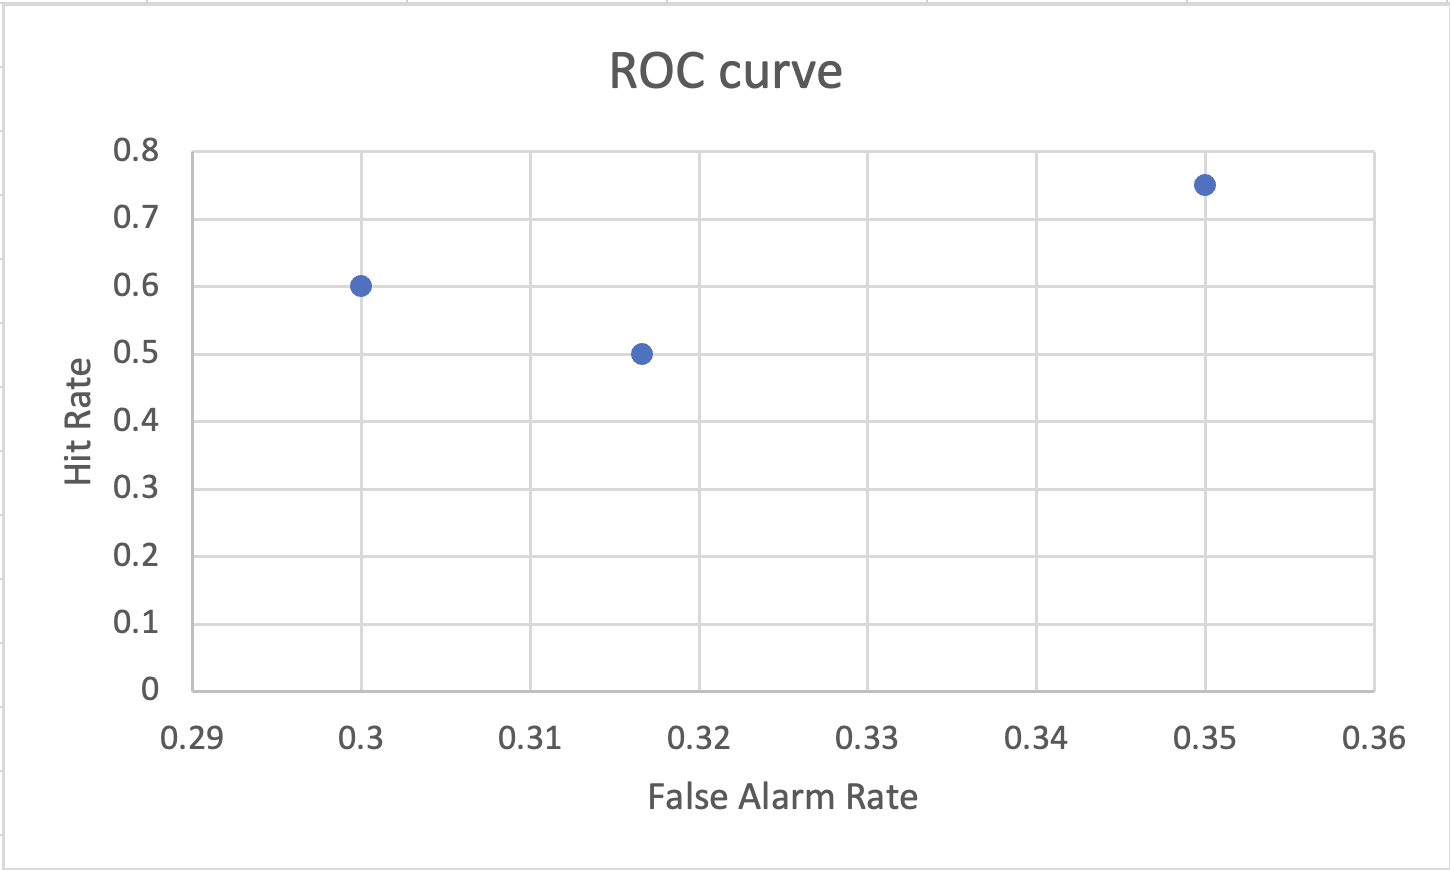
Changing the base rate decreased the sensitivity, for the first condition (3:1) meaning that there were lots of hits and lots of false alarms. That could be due to the fact that responses were weighted towards A, so I was likely to press A more often. D’ decreased from the 50:50 to the 3:1 conditions, meaning it was harder to distinguish between the two signals in the 3:1 trial. Beta stayed the same for the 50:50 and 3:1 conditions, meaning I was equally as liberal with my responses in both conditions. D’ increased from the 50:50 to the 1:3 condition, meaning it was easier for me to distinguish between the signals in the 1:3 condition. This is shown by the bow being further from the center line. That could be because I had already completed the 3:1 trial and was more familiar with the rules of the activity and had practice. Beta decreased from the 50:50 to the 1:3 condition, which means that I was even more liberal with my answers in this condition. This may be due to a similar reason as the 3:1 condition - that I knew that majority of the answers were going to be B, so I was more liberal with that response.
Step 4
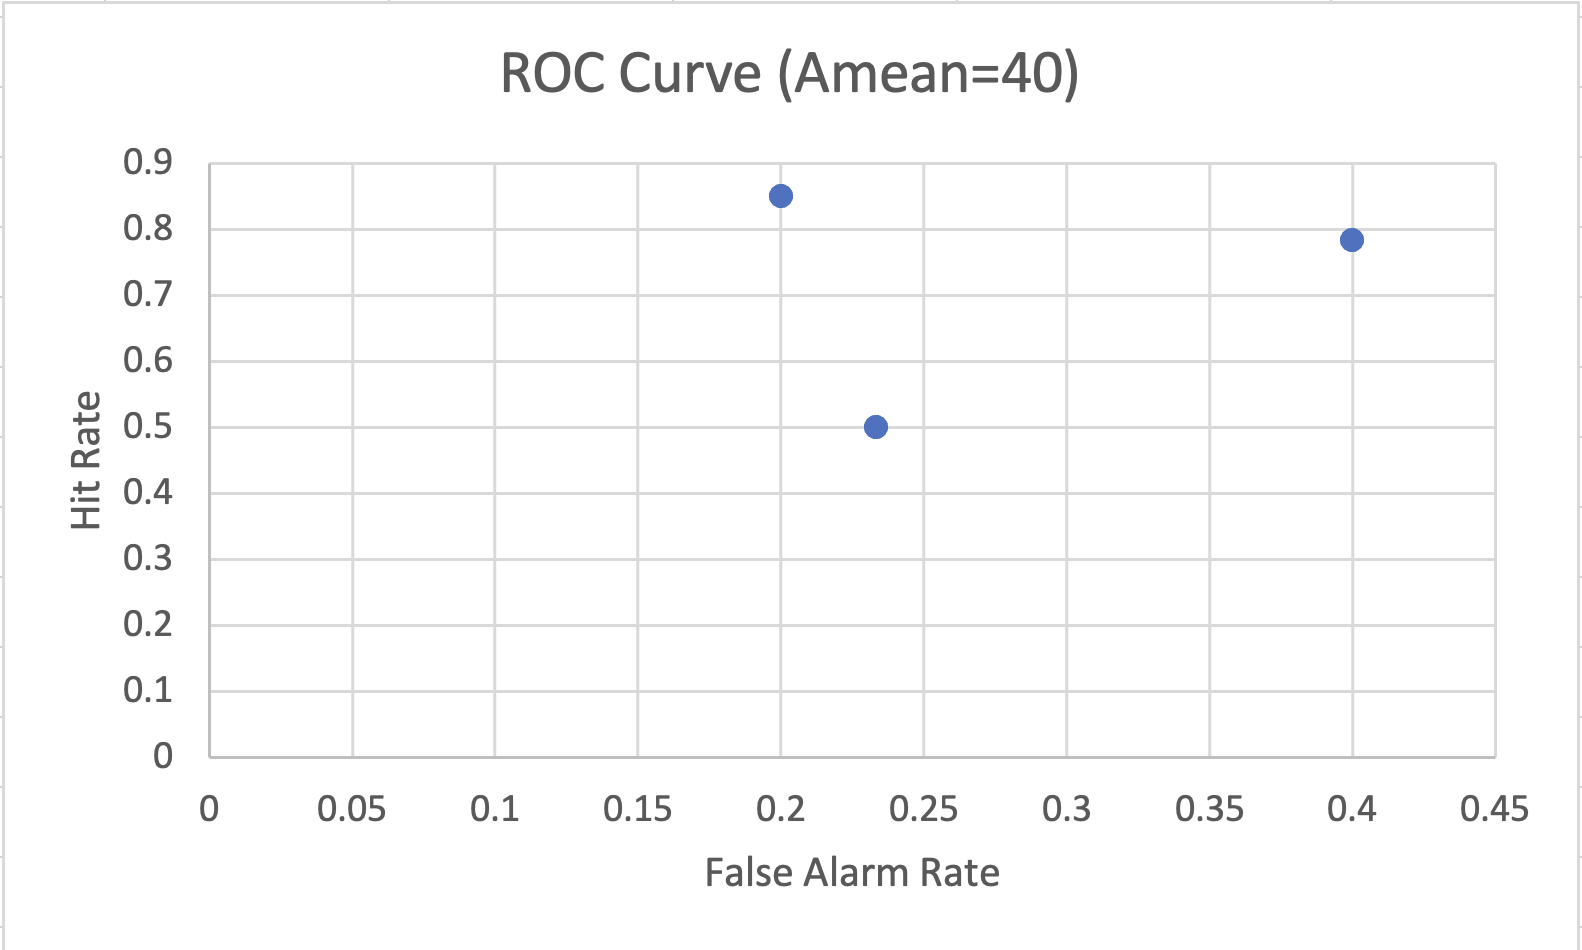
After changing the mean of A from 46 to 40, the ROC curve changes. The 50:50 condition shows an increase in d’, meaning it was easier to tell the difference between A and B. This change doesn’t apply for the 3:1 and 1:3 conditions, however. Both of those conditions have a d’ closer to zero, meaning it was harder to distinguish between A and B. Decreasing the mean of A means that it should be more different than B, and theoretically easier to distinguish; however, it seems like that was only the case for the 50:50 condition for my tests.


Conclusion
As the experimenter and the research participants, I can say these were difficult tests. Distinguishing between the A and B formations was really difficult, but it was fascinating to see where my abilities lay to tell the difference between the two. There are so many real world applications for signal detection theory, such as hospitals and ICUs. It would be interesting to conduct a signal detection theory experiment in the healthcare system to see the effect of alarms on nurses managing multiple patients with multiple medical devices. Next time, I’d like to conduct a version of this experiment that takes real world distractions into account. For example, I can test people’s ability to distinguish between signals while simultaneously focusing on another task, like carrying a conversation or listening to instructions.
As the experimenter and the research participants, I can say these were difficult tests. Distinguishing between the A and B formations was really difficult, but it was fascinating to see where my abilities lay to tell the difference between the two. There are so many real world applications for signal detection theory, such as hospitals and ICUs. It would be interesting to conduct a signal detection theory experiment in the healthcare system to see the effect of alarms on nurses managing multiple patients with multiple medical devices. Next time, I’d like to conduct a version of this experiment that takes real world distractions into account. For example, I can test people’s ability to distinguish between signals while simultaneously focusing on another task, like carrying a conversation or listening to instructions.